Flowcharts have become increasingly popular as a means of documenting and visualizing various processes. Due to their flexibility and adaptability, individuals from diverse fields have incorporated the use of flowcharts into their decision-making, problem-solving, and system improvement endeavors. Flowcharts serve as a powerful tool to simplify complex concepts, streamline workflows, and optimize systems for maximum efficiency. From manufacturing and engineering to healthcare and finance, flowcharts have proven to be an invaluable asset for enhancing productivity and achieving desired outcomes. Whether creating new processes or analyzing existing ones, flowcharts provide a clear and concise roadmap for achieving success.
What is a Flowchart?
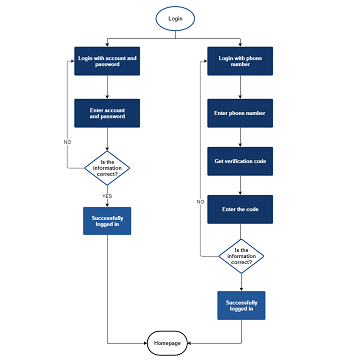
A flowchart is a visual representation of a process or algorithm. It consists of a set of standardized symbols that are used to depict the various steps, decisions, and actions involved in the process.
Flowcharts are commonly used in computer programming, business process mapping, project management, and other fields to help people understand complex systems or processes. They provide a clear and concise way to document a process, making it easier for others to understand and follow.
There are many different types of symbols used in flowcharts, including rectangles for process steps, diamonds for decision points, and arrows for connecting the different symbols. The flowchart is read from top to bottom and left to right, with each symbol representing a specific action or decision.
When to use a Flowchart?
Process analysis and improvement:
Flowcharts can be used to analyze and improve existing processes by breaking them down into their component parts and identifying areas for improvement. This can help to streamline processes and increase efficiency.
System development:
Flowcharts are commonly used in computer programming to help develop and understand software systems. They can be used to visualize the flow of information and logic within a system, making it easier to design and implement.
Project management:
Flowcharts can be used in project management to plan and coordinate tasks and activities. They can help identify dependencies between tasks, and visualize the critical path of a project.
Training and documentation:
Flowcharts can be used to document procedures and workflows, making it easier for employees to understand and follow them. They can also be used in training programs to help new employees understand complex processes.
Decision-making:
Flowcharts can be used to help with decision-making by providing a visual representation of different options and their potential outcomes. This can help to clarify complex decision-making processes and facilitate more informed decision-making.
Flowchart symbols and definitions
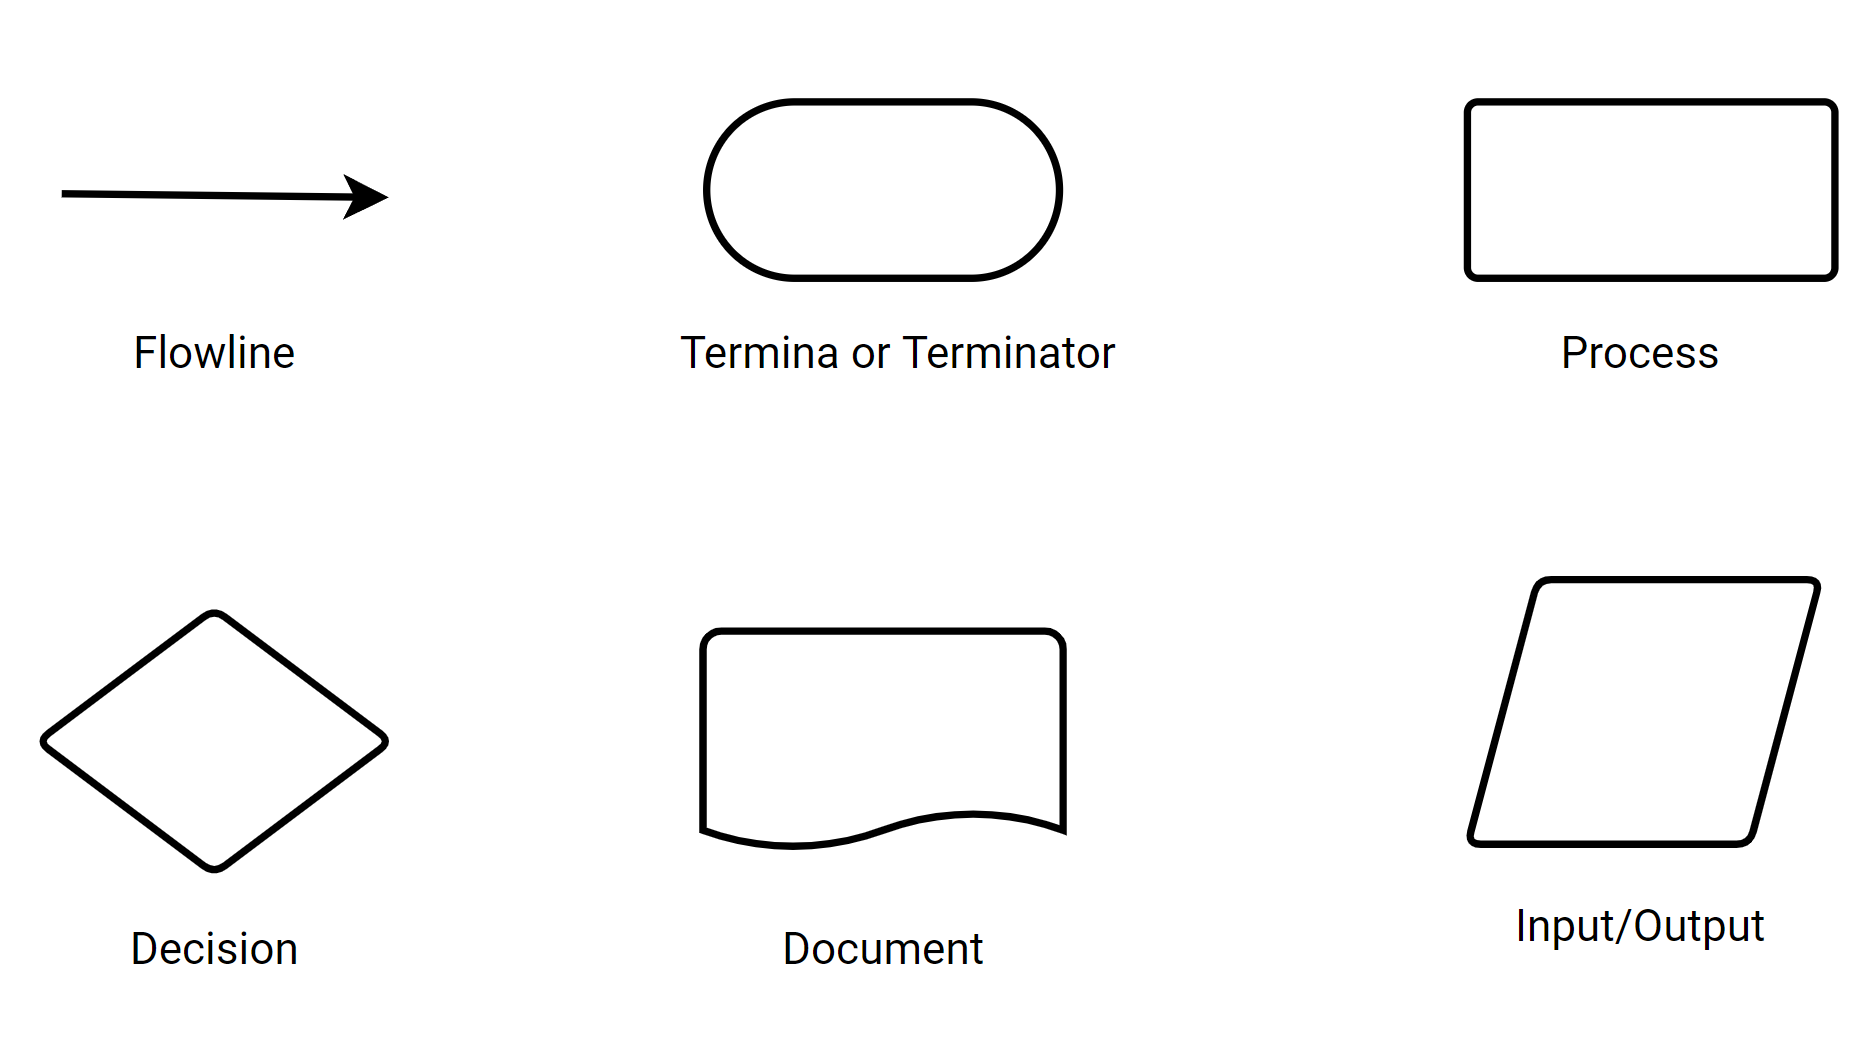
Flowline:
The flowline shows the process’s direction by connecting two blocks with one another.
Termina or Terminator:
The terminal or terminator represents the start or end points of a flowchart process.
Process:
The process symbol is the most common component of a flowchart and indicates a step in the process.
Decision:
This symbol represents a decision you or your team need to make to get to the next step of the process. Typically, it’s a true or false decision or a yes or no question that you need to answer.
Document:
This symbol represents a single document.
Input/Output:
The input/output symbol represents the process of in- or outputting external data.
' gradientUnits='userSpaceOnUse'%3E%3Cstop offset='.143' stop-color='%23d5effc'/%3E%3Cstop offset='.842' stop-color='%233c8ec6'/%3E%3Cstop offset='1' stop-color='%2339c'/%3E%3C/radialGradient%3E%3Cpath fill='url(%23a)' d='M67.823 57.787c.154-1.553 1.451-20.462-14.797-29.05-7.596-4.018-17.848-3.964-23.477 1.74-9.948 10.068-1.514 20.621 1.642 21.669.12.035.075-.047.044-.174-4.996-19.942 29.742-23.512 35.881 5.71.218 1.035.615 1.011.707.105z'/%3E%3CradialGradient id='b' cx='475.332' cy='-726.447' r='19.084' gradientTransform='matrix(1 0 0 -1 -432 -666)' gradientUnits='userSpaceOnUse'%3E%3Cstop offset='.143' stop-color='%23fee588'/%3E%3Cstop offset='.564' stop-color='%23f79b30'/%3E%3Cstop offset='.687' stop-color='%23f58b2d'/%3E%3Cstop offset='.888' stop-color='%23f3752a'/%3E%3Cstop offset='1' stop-color='%23f36c29'/%3E%3C/radialGradient%3E%3Cpath fill='url(%23b)' d='M27.743 81.9c1.55.147 20.459 1.439 29.049-14.805 4.018-7.599 3.963-17.853-1.737-23.479-10.073-9.947-20.625-1.516-21.673 1.646-.025.065.074.065.172.044 19.944-4.996 23.512 29.744-5.705 35.883-1.038.215-1.015.611-.106.711z'/%3E%3CradialGradient id='c' cx='-415.647' cy='-620.671' r='26.288' gradientTransform='matrix(0 -1 -1 0 -591.623 -371.307)' gradientUnits='userSpaceOnUse'%3E%3Cstop offset='0' stop-color='%23fcb116'/%3E%3Cstop offset='.193' stop-color='%23fbb318'/%3E%3Cstop offset='.335' stop-color='%23f9b91c'/%3E%3Cstop offset='.461' stop-color='%23f6c323'/%3E%3Cstop offset='.577' stop-color='%23f4d12d'/%3E%3Cstop offset='.673' stop-color='%23f0e03a'/%3E%3Cstop offset='.744' stop-color='%23e5d534'/%3E%3Cstop offset='.865' stop-color='%23cfbd24'/%3E%3Cstop offset='1' stop-color='%23b19e11'/%3E%3C/radialGradient%3E%3Cpath fill='url(%23c)' d='M3.634 41.813c-.155 1.552-1.448 20.46 14.801 29.052 7.595 4.018 17.848 3.962 23.476-1.741 9.948-10.069 1.518-20.621-1.645-21.669-.131-.047-.088 0-.045.172C45.22 67.57 10.48 71.137 4.34 41.919c-.219-1.038-.613-1.011-.706-.106z'/%3E%3CradialGradient id='d' cx='473.191' cy='-709.119' r='26.288' gradientTransform='matrix(1 0 0 -1 -432 -666)' gradientUnits='userSpaceOnUse'%3E%3Cstop offset='0' stop-color='%23a1c43a'/%3E%3Cstop offset='.455' stop-color='%23a0cc3a'/%3E%3Cstop offset='1' stop-color='%233c943a'/%3E%3C/radialGradient%3E%3Cpath fill='url(%23d)' d='M43.715 17.704c-1.549-.153-20.46-1.444-29.05 14.803-4.016 7.595-3.963 17.847 1.74 23.474 10.069 9.949 20.621 1.521 21.67-1.645.022-.09.022-.09-.172-.041-19.941 4.996-23.508-29.746 5.708-35.884 1.042-.216 1.01-.612.104-.707z'/%3E%3Cg opacity='.6'%3E%3CradialGradient id='e' cx='434.848' cy='-357.278' r='30.374' gradientTransform='matrix(1.0987 0 0 -1.6216 -441.9 -504.471)' gradientUnits='userSpaceOnUse'%3E%3Cstop offset='0' stop-color='%23f9e788'/%3E%3Cstop offset='1' stop-color='%23fff'/%3E%3C/radialGradient%3E%3Cpath opacity='.38' fill='url(%23e)' d='M35.729 30.865c-2.779 0-5.424.53-7.83 1.492-7.272 9.464.331 18.803 3.291 19.79.12.035.075-.047.044-.174-3.052-12.189 8.743-18.262 19.776-14.465-3.684-4.064-9.163-6.643-15.281-6.643z'/%3E%3CradialGradient id='f' cx='434.85' cy='-357.281' r='30.373' gradientTransform='matrix(1.0987 0 0 -1.6216 -441.9 -504.471)' gradientUnits='userSpaceOnUse'%3E%3Cstop offset='0' stop-color='%23f9e788'/%3E%3Cstop offset='1' stop-color='%23fff'/%3E%3C/radialGradient%3E%3Cpath opacity='.38' fill='url(%23f)' d='M33.381 45.264c-.025.065.074.065.172.044 12.048-3.02 18.119 8.458 14.6 19.377 4.67-3.473 7.668-8.848 7.668-14.88 0-2.354-.456-4.604-1.286-6.681-9.912-9.166-20.123-.97-21.154 2.14z'/%3E%3CradialGradient id='g' cx='434.851' cy='-357.277' r='30.368' gradientTransform='matrix(1.0987 0 0 -1.6216 -441.9 -504.471)' gradientUnits='userSpaceOnUse'%3E%3Cstop offset='0' stop-color='%23f9e788'/%3E%3Cstop offset='1' stop-color='%23fff'/%3E%3C/radialGradient%3E%3Cpath opacity='.38' fill='url(%23g)' d='M40.266 47.455c-.131-.047-.088 0-.045.172 3.055 12.193-8.742 18.262-19.775 14.465 3.684 4.063 9.164 6.643 15.284 6.643a21.15 21.15 0 0 0 7.828-1.484c7.275-9.468-.327-18.813-3.292-19.796z'/%3E%3CradialGradient id='h' cx='434.848' cy='-357.278' r='30.373' gradientTransform='matrix(1.0987 0 0 -1.6216 -441.9 -504.471)' gradientUnits='userSpaceOnUse'%3E%3Cstop offset='0' stop-color='%23f9e788'/%3E%3Cstop offset='1' stop-color='%23fff'/%3E%3C/radialGradient%3E%3Cpath opacity='.38' fill='url(%23h)' d='M38.075 54.336c.022-.09.022-.09-.172-.041-12.045 3.016-18.115-8.46-14.597-19.376-4.672 3.468-7.67 8.846-7.67 14.886 0 2.345.458 4.595 1.285 6.669 9.912 9.167 20.124.971 21.154-2.138z'/%3E%3C/g%3E%3C/svg%3E)